
What to Expect from an SEO Agency
SEO is not a tangible product, making it difficult to compare the offerings of each vendor. Results depend on a sound strategy, time, hard work, and are subject to change due to algorithm updates and competition. No credible SEO can guarantee results, so how can you assess SEO Value and What to Expect from an SEO Agency?
This is one of the primary reasons why we, at Zelst, publish the average of all our client data for the previous year, every year. Past performance, of course, is no guarantee of future results, but a nineteen-year track record and a history of achieving outstanding results provide an indication of what you can expect from an SEO Agency and a gauge of potential SEO Value in 2025.
Methodology
Because we were late in reporting our data last year, we reported on the twelve months to the end of March 2024. This year, we’ve slipped back two further months and are reporting the data for the twelve months to the end of May 2025.
We analysed the aggregate data from our 25 client sites, across a mix of industries and sectors including Health, Finance, Technology, ecommerce, Construction, Law, Utilities, Energy, Logistics, Sports, Engineering, Advertising and Marketing, Education, Fitness and Wellness, Hospitality and Consultancy, across both B2B and B2C.
The sites analysed varied in size from around a thousand clicks to around two million clicks per month, so a reasonably wide range of sizes. Because of this, we report only on changes in performance and average the percentage changes, rather than aggregate numbers.
We recorded data from June 1, 2024, to May 31, 2025, unless a client joined us midway through that year, in which case we only analysed data from the time of onboarding.
We analysed the data irrespective of the SEO Lifecycle/Stage of the plan. Some of the sites analysed had been with us for several years, were at a relatively mature stage in their SEO lifecycle, and were experiencing steady growth. In contrast, others were new to us and were in the early stages of their plan, typically where we had a lot of remedial actions to undertake, and, in some cases, intensive surgery.
During the course of this year, we also performed nine, yes NINE (9), site migrations, all of which we undertook in six weeks in September and October. These are all included in the year's data. As you may be aware, moving to a new site typically sets back most sites in their SEO progress, but we are still including the data in this analysis.
All the data is pulled from our client accounts on Semrush, Google Analytics, Google Search Console, Google Ads, and Microsoft Ads, and has been shared with our clients individually throughout the year through our regular client reporting on our Swydo reporting platform. Because we never rely on one single source of information, all data has been verified using Ahrefs, Moz, Google Analytics, Google Search Console, Bing Webmaster Tools, Google Ads, and Microsoft Ads.
How did Zelst perform for its clients over the Last Year?
The year was another challenging one, with elections in both the UK and the US, as well as in 68 other countries (representing more than half the world’s population), and was described as the largest election year in history.
Business confidence suffered as a result of the uncertainty and subsequent increases in taxes in the UK and tariffs in the USA. This resulted in marketing budgets coming under pressure or decisions being put on hold.
Google also contributed to the challenging conditions by rolling out several algorithm updates focused on improving content quality, reducing spam and enhancing user experience. AI Overviews became an increasingly prevalent feature of SERPs, which had a major impact on traffic, and the use of generative search became much more widespread.
After all that, let’s dig into the details and see how Zelst performed in the face of all of this.
SEO Metrics
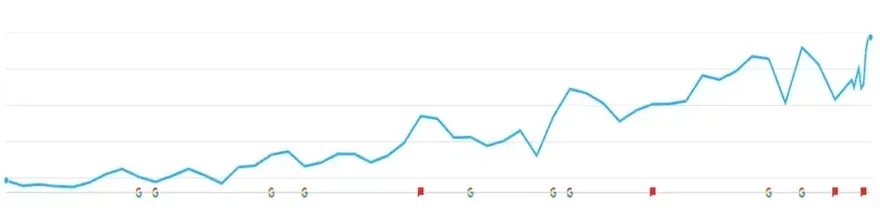
Search Visibility
Search visibility is a metric that we use to judge how well a site is performing in search for the keywords we are targeting in a campaign. Semrush defines the metric as a representation of how visible the domain is among searchers for its target keywords. A zero-per-cent visibility means a domain doesn’t rank in Google’s top 100 results for any of its tracked keywords, whilst a 100-per-cent visibility score means a site holds the number one position in the Search Engine Result Pages (SERPs) for all of its target keywords.
Each of our clients has different objectives based upon their own particular business strategy and most clients' SEO Strategies are at different stages of maturity. Many of our new clients tend to start from a very low base, or are in decline, having lost visibility, or are launching a brand-new site, with the lack of visibility inherent in that. Our longer-standing clients will typically have a significantly higher level of visibility, having benefited from several years of strong search engine optimisation (SEO) efforts. As a result, growth will often be harder to achieve for established clients (If you rank number one for all of your keywords, the only way you’ll improve things is if the volume of searches goes up or you widen the keyword profile).
If there is a high level of brand searches in a campaign, visibility will be higher; however, if we are looking to increase visibility, we tend to focus more on non-brand searches.
Over the course of the last twelve months, we increased the average search visibility of all of our clients by over one and a half times, an increase of 155.23%.
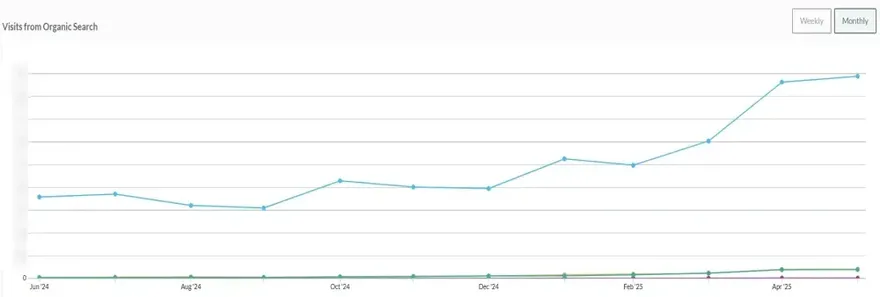
Organic Search Traffic
An Improvement in search visibility will tend to feed through into an increase in organic search traffic, though the two figures often don’t correlate directly. Sometimes, large improvements in visibility can lead to relatively small improvements in traffic and vice versa.
Over the past twelve months, with the increase in appearance of AI Overviews, there has been a significant increase in Zero Click searches, which has meant, often, declines in organic search traffic.
However, during this time, we actually increased our average client organic search traffic by nearly two and a half times, an actual improvement in organic traffic of 241.39%!
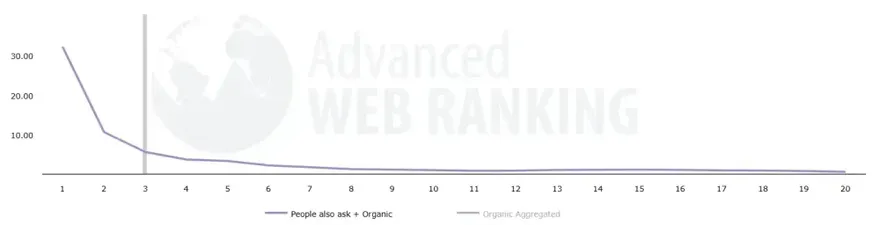
Average Search Position
While Search Visibility focuses on click-through rate (CTR) and heavily favours the top three positions in the search engine results pages (SERPs), Average Position provides a broader view of overall keyword ranking performance. As illustrated in the accompanying graph from Advanced Web Ranking, the CTR for Position #1 is over three times higher than Position #2, nearly six times that of Position #3, and more than thirty times greater than Position #10.
Our goal is to secure top-three rankings for all target keywords across our clients' portfolios. In the year ending May 2025, we achieved a 21.28% improvement in average keyword position. It’s worth noting that this metric naturally tapers as more keywords reach the #1 spot, as once rankings plateau at the top, further percentage gains become marginal by definition.
Top 3 Keyword Positions
Our key strategic priority is to position our clients’ content where it generates the greatest return, and this typically occurs at the top of the search results. Securing top-three positions for every high-value keyword isn’t just about visibility; it’s about dominating the digital landscape, outpacing competitors, and maximising return on investment.
Over the past 12 months, we’ve achieved a 151.92% increase in top-three rankings for our clients. This surge has significantly enhanced our clients’ market presence, improved their brand positioning, and funnelled high-intent traffic to their sites, translating directly into measurable business growth. In highly competitive sectors, these gains aren’t just impressive, they really are game-changing.
Top 10 Keyword Positions
While our ultimate goal is to rank every strategic keyword in the top three positions, where the vast majority of clicks and conversions occur, securing page one visibility (positions 1–10) remains a critical milestone. Page one rankings not only drive significantly greater visibility than lower pages, but they also serve as the essential foundation for climbing into the top three, as well as a foundation for gaining AI Overview presence. Essentially, every step up the rankings strengthens our client brand’s authority, reach, and competitive edge.
Over the past 12 months, we’ve delivered a 250.04% increase in top 10 keyword positions across our client portfolio. This growth isn’t just about improved rankings; it generates a substantial uplift in high-value traffic, stronger brand positioning, and a clear path to dominating the most competitive search landscapes.
Organic Search ROI
One (fairly) new metric we’ve introduced this year is Organic Search Return on Investment (ROI). A common challenge of SEO is the difficulty of properly attributing a value to the work undertaken.
There are many ways of looking at it, and it’s fair to say that there's no definitive scientific way to equate the value a good organic search presence has for your business or organisation. How do you value the brand value of high visibility in every key search query related to your business's products or services?
However, we’ve chosen the most scientific method we can by valuing Organic Search Traffic at what searches for those terms would cost if you had to acquire the visits through Paid Advertising, using Semrush’s "organic traffic value" metric, sense-checked against Ahref’s equivalent traffic value. This, of course, ignores the fact that over 80% of all queries and searches don’t trigger Google Ads so don’t have a value/price, as such, and also that many people still say that they trust an organic result more than a paid one. This, however, at least provides an indication of the value of SEO Traffic and work, even if it is an unvalued one.
Over the course of the last twelve months, Zelst achieved an Average Organic Search ROI for its clients of a pretty impressive 1279%.
PPC Metrics
Every day, we rigorously track and analyse all key PPC metrics and KPIs to ensure our clients' budgets are invested with maximum efficiency and optimal effectiveness. Our clear goal is to deliver measurable results by aligning paid media performance with business objectives, increasing market visibility at each and every critical touchpoint, and driving the highest possible return on investment for our clients.
As with SEO, PPC performance is deeply influenced by both campaign objectives and account maturity. New accounts, or those with limited prior optimisation, often experience substantial performance gains once brought under our management, whilst more mature accounts benefit from incremental improvements through ongoing refinement, bid strategy adjustments, and performance tuning.
Campaign intent also plays a critical role in shaping metrics. Aggressive growth strategies, such as launching new products, targeting premium audiences, or expanding into competitive markets, often require higher bidding, which can increase cost per click (CPC) and lower the return on ad spend (ROAS) in the short term. Conversely, campaigns focused on profitability tend to yield stronger performance indicators, including lower cost per acquisition (CPA) and higher return on investment (ROI).
With that context in mind, the following four performance metrics represent results we’ve delivered across a diverse range of clients, each at a different stage of growth and with distinct and unique commercial goals.
Average Improvement In Click Through Rate
Click-Through Rate (CTR) is an often underestimated yet pivotal metric that directly influences Quality Score, which in turn dictates both AdRank/advertising visibility and Cost Per Click (CPC). It used to be a common misconception that high impressions, coupled with low clicks, i.e., a low CTR, equated to a free lunch in terms of free brand exposure. This perspective, however, overlooked Google's sophisticated algorithms. Google prioritises ad relevance and user engagement, recognising that ads people genuinely interact with enhance the search experience and drive more clicks, ultimately increasing their revenue.
By focusing on the relevancy and quality of ads, organisations can achieve a multifaceted improvement in their digital advertising performance. This strategic approach not only cultivates better brand perception and engagement but also leads to a higher CTR, a superior Quality Score, improved ad rankings, and significantly lower CPCs. Over the past 12 months, our initiatives have yielded an impressive average improvement in Click-Through Rate of 9.12%. This tangible result highlights the significant impact of prioritising ad quality and relevance for optimising digital advertising ROI.

Average Improvement in Conversions
In search advertising, conversions are the unequivocal ultimate metric. The fundamental objective of any advertising campaign is to prompt specific, valuable user actions, whether that be the purchase of a product or service, the completion of an enquiry form, the download of content or an asset, or a direct call to your sales team. We meticulously track and measure each critical actions as a conversion.
We firmly believe that enhancing conversion rates is absolutely essential to the success and profitability of every ad campaign. This principle drives our strategic focus on conversion improvement as a core performance indicator. Over the past 12 months, our extensive, data-driven approach has yielded an average improvement in conversions of an outstanding 902.73% for our clients. This significant achievement underlines our commitment to maximising our clients' return on investment by transforming ad interactions into tangible, measurable business outcomes.
Average Improvement in Conversion Value
For e-commerce businesses, conversion value is a critically important metric, offering deep, measurable insight into the value of each individual order. Although the ideal scenario often involves an upward trend in average order value (AOV), signifying more valuable sales, this metric is inherently linked to a business's overarching strategic direction and product mix. A company might, for instance, intentionally pivot towards a high-volume sales model or introduce more accessible, lower-priced items, which can naturally influence the average conversion value.
Beyond simply increasing the number of conversions, our dedicated efforts and sharp commercial focus over the past 12 months have driven a dramatic increase in the value derived from each conversion. We've achieved an average improvement in conversion value of an impressive 1534.88% for our clients. This massive leap demonstrates our ability to not only optimise for quantity of sales but, crucially, to significantly enhance the profitability of each transaction.
Average Return on Ad Spend (ROAS) for Ecommerce Clients
For ecommerce businesses, Return on Ad Spend (ROAS) stands as a critical and indispensable metric. It precisely quantifies the revenue generated for every dollar or pound invested in advertising. For instance, a ROAS of 500% signifies that every dollar or pound spent on ads yields five dollars or pounds of sales revenue.
A "good" ROAS varies significantly based on market dynamics, pricing strategies, competitive landscapes, and profit margins; however, achieving a positive ROAS is always the baseline. In some highly competitive markets, a positive return is considered a success, while in others, a robust ROAS often reaches well into three figures.
Across our diverse portfolio of e-commerce clients, we've demonstrated a strong commitment to maximising advertising efficiency and effectiveness. Over the past twelve months, we've achieved an outstanding average Return on Ad Spend (ROAS) of 1092%. This figure underlines our proven ability to drive substantial revenue growth and maximise the profitability of our clients' advertising investment.
Average Improvement In ROAS
While the absolute Return on Ad Spend (ROAS) is a vital indicator, examining the average improvement in this metric offers deeper insight into sustained performance gains. This improvement, however, is heavily influenced by dynamic business strategies and market conditions.
Over the past twelve months, our strategic interventions have yielded a demonstrable average improvement in ROAS of 113.4% for our clients. This consistent uplift emphasises our commitment to achieving not only strong ROAS figures but also continuously enhancing the efficiency and profitability of our clients' marketing and advertising investment.
Zelst Performance Metrics for Clients 2023/24
SEO KPI'S
| METRIC | AVERAGE CHANGE |
|---|---|
| SEARCH VISIBILITY | 155.23% |
| ORGANIC SEARCH TRAFFIC | 241.39% |
| AVERAGE SEARCH POSITION | 21.28% |
| TOP 3 KEYWORDS | 151.92% |
| TOP 10 KEYWORDS | 250.04% |
| AVERAGE ORGANIC ROI | 1279% |
PPC KPI's
| METRIC | AVERAGE CHANGE |
|---|---|
| AVERAGE IMPROVEMENT IN CLICK THROUGH RATE | 9.12% |
| AVERAGE IMPROVEMENT IN CONVERSIONS | 902.73% |
| AVERAGE IMPROVEMENT IN CONVERSION VALUE | 1534.88% |
| AVERAGE RETURN ON AD SPEND (ROAS) FOR ECOMMERCE CLIENTS | 1092% |
| AVERAGE IMPROVEMENT IN ROAS | 113.40% |
If your business would benefit from this sort of performance, please call us now or complete this form.